


.png)
Highlights & knowledge points of the SPLIT Remote Sensing Summer School
Antria Christodoulou
Geospatial Data ScientistAfter a week-long SPLIT Remote Sensing summer school at EURAC in Bolzano, I have concluded the following:
- This SPLIT Remote Sensing summer school was a really good combination between learning and having fun;
- Remote sensing knowledge is refreshed and expanded;
- Point cloud processing was my favorite subject;
- Complex subjects can be easily explained if you are properly prepared or if you are a natural teacher;
- The whole event was very good organized;
- Bolzano is an amazing city;
- If you don’t speak German or Italian you might have difficulties ordering at restaurants in Bolzano;
- With the first opportunity I would like to use the things I’ve learned;
- SPLIT Remote Sensing school is highly recommended.
If you are interested about the knowledge points of this full week continue reading!
The first week of June, the 6th SPLIT Remote Sensing professional summer school took place in EURAC Research in Bolzano-Bozen, Italy. Supported by Tensing GIS Consultancy, I had the opportunity to travel from the Netherlands to attend the training along with other professionals coming from Croatia, Slovenia, Germany, Italy, Algeria, United Arab Emirates, USA, India and Switzerland.
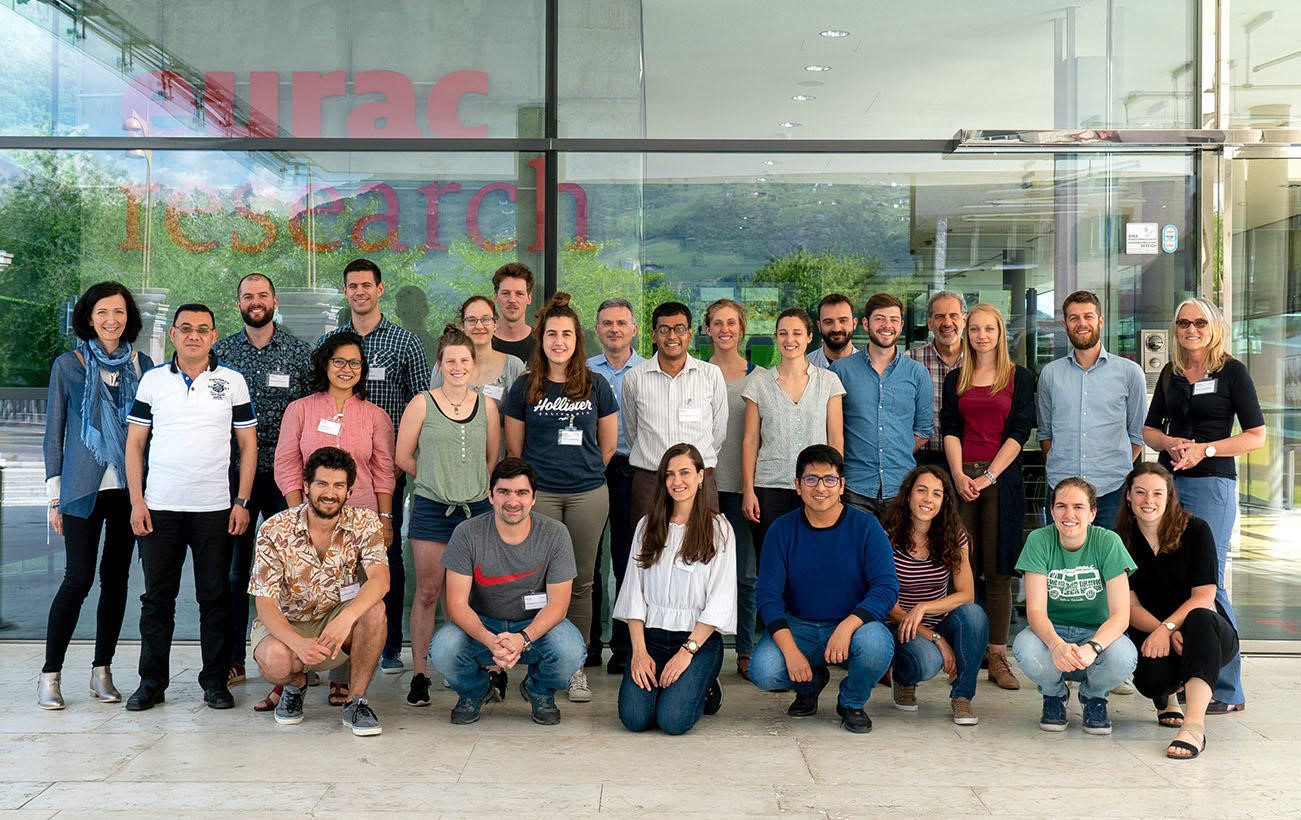
Figure 1. The participants, some of the instructors and some of the organizers of the SPLIT Remote Sensing school.
The summer school was very well organized, very interesting and it was an opportunity for every participant to enrich their knowledge in the field of remote sensing. I would truly recommend it to anybody who is interested in this field.
Below I summarize the highlights and the most important (to my opinion knowledge points) of each of the 6 days!
Day 1: Synthetic Aperture Radar day
By Mattia Callegari, Carlo Marin and Giovanni Cuozzo
The first day was about SAR sensors, which can operate in day or night conditions and can penetrate through clouds and to a certain extent vegetation, ice and soil. After having discussed about the concepts behind SAR data and the methods to apply to SAR imagery to enhance their quality, we proceeded to the workshop. The purpose was to detect the snowmelt areas between two SAR images and which we downloaded from an open source online platform. Mapping snowmelt areas can help taking measures against damages from flooding. The basic idea behind the detection of snowmelt areas is the difference between the backscattering when the snow hit by microwaves is wet and when is dry. Based on this information we started the processing of the SAR images in an open source software from ESA (but other comparable, free and commercial software were also mentioned). We applied a series of processing steps so that the two images are free from noise and distortions, and applied a co-registration so that we can compare them. The output image of the comparison was used to classify the wet and dry snow areas based on a thresholding method.
Day 2: Field Trip to Corvara
By Giovanni Cuozzo & Christian Kofler & Abraham Mejia-Aguilar & Stefan Steger
The field trip had two purposes. The first was to in inspect landslides in the surroundings of Corvara in the Dolomites and to contribute to their monitoring by carrying out a UAV flight to collect and process aerial imagery. UAV aerial images were processed during the 5th day of the training.
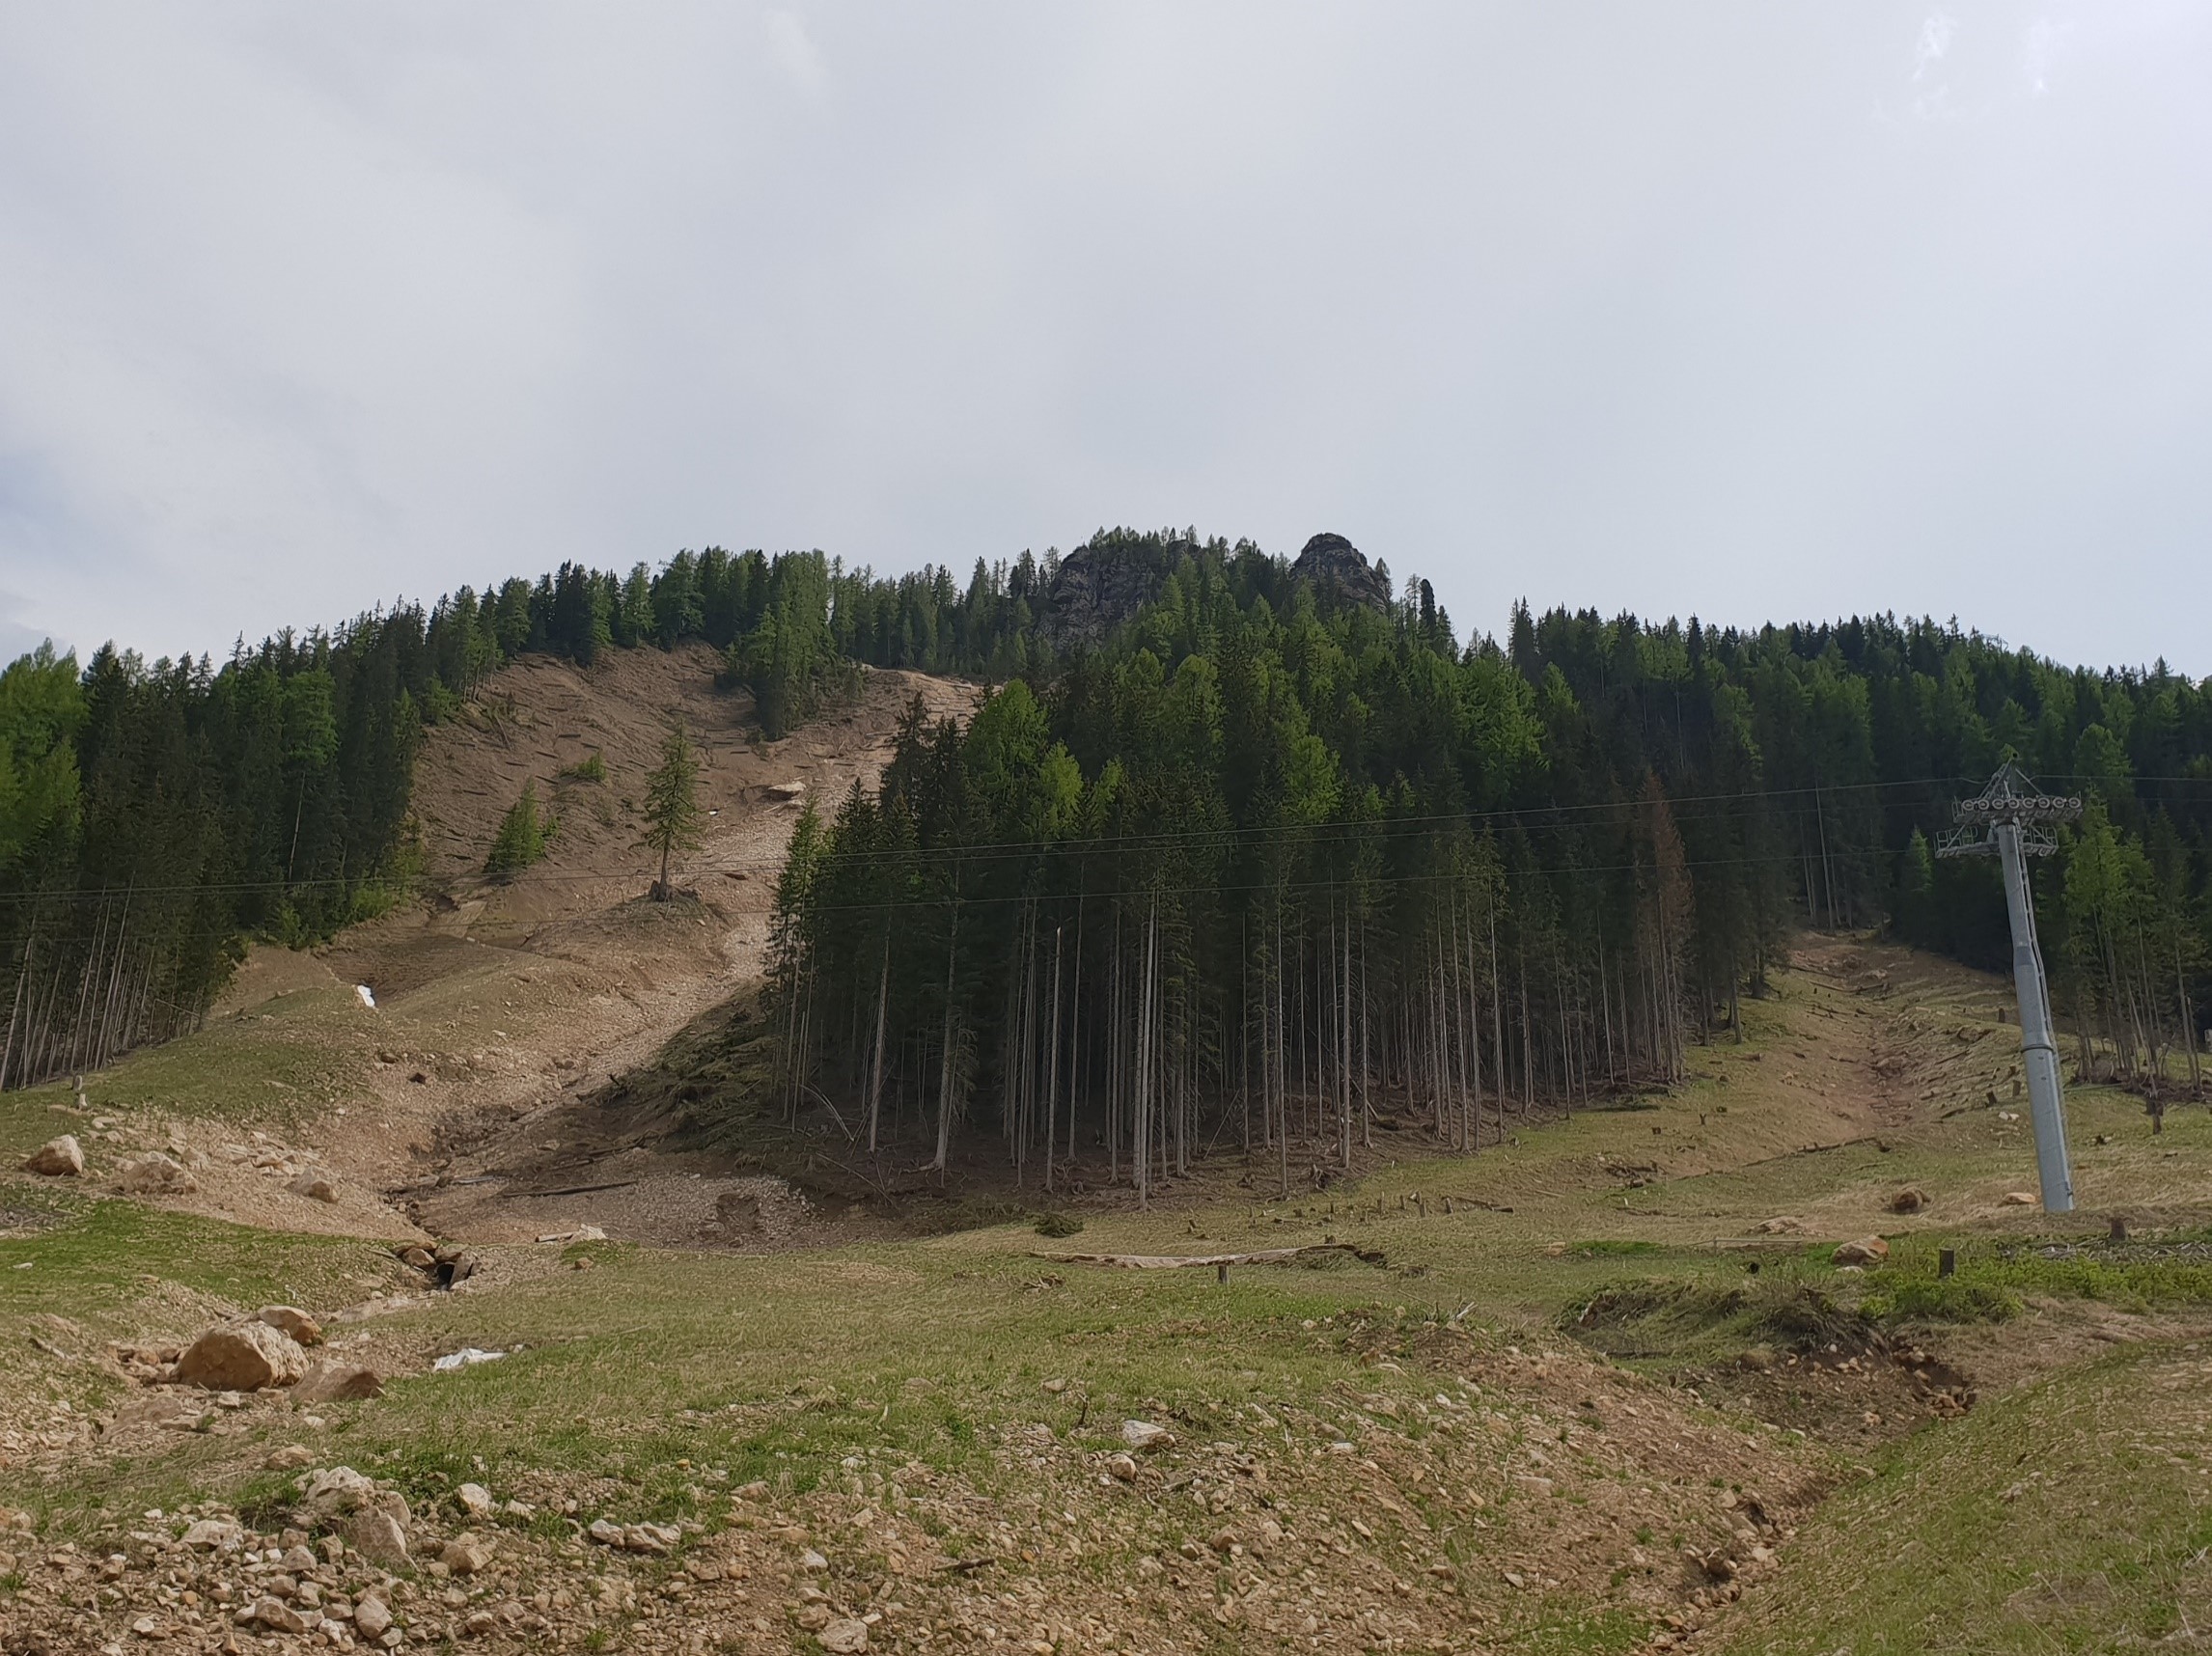
Figure 2. An example of a landslide that occurred the last years in the area of Corvara is illustrated in the image below. Soil bioengineering (brown ‘bars’ on the eroded area) is used to prevent soil to be eroded again and to help the revegetation of the area.
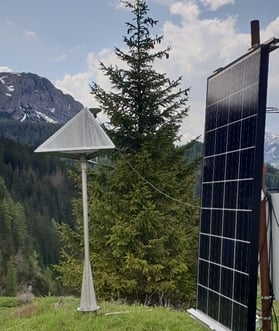 The image on the right illustrates a GPS station with a trihedral corner reflector in the wider area of a landslide. GPS stations are established in the area to be used at a later stage for the geo-rectification of the collected images; transition from the image coordinate system to a geographical coordinate system. To improve the location accuracy of the GPS stations in the landslides area, a fixed ground-based reference station in the municipality of Corvara is used to provide the difference between the GPS positions in the landslides area and it self. The trihedral corner reflectors contribute to change detection techniques applied between radar imagery acquired from slightly different orbit positions and/or at different times. The corner reflectors are used as target points between the compared imagery as they can be easily distinguished. This happens due to their ability to highly reflect radar signals in the direction of the radar receiver.
The second purpose of the field trip was to collect hyperspectral data; recording of the reflected radiance in hundreds of bands of the electromagnetic spectrum. To do so, we used a spectroradiometer which can measure the continuous spectral radiance reflected across a range of the electromagnetic spectrum from single point-targets. In the image below, we have being calibrating the spectroradiometer with a white target before using it to collect data from: a) unhealthy vegetation, b) healthy vegetation and c) bare soil. We could immediately observe in a mobile device the ‘spectral signature’ of each of the three targets and notice the differences. The data collected from the field with a spectroradiometer can be used as a reference when developing techniques for land cover image classification.
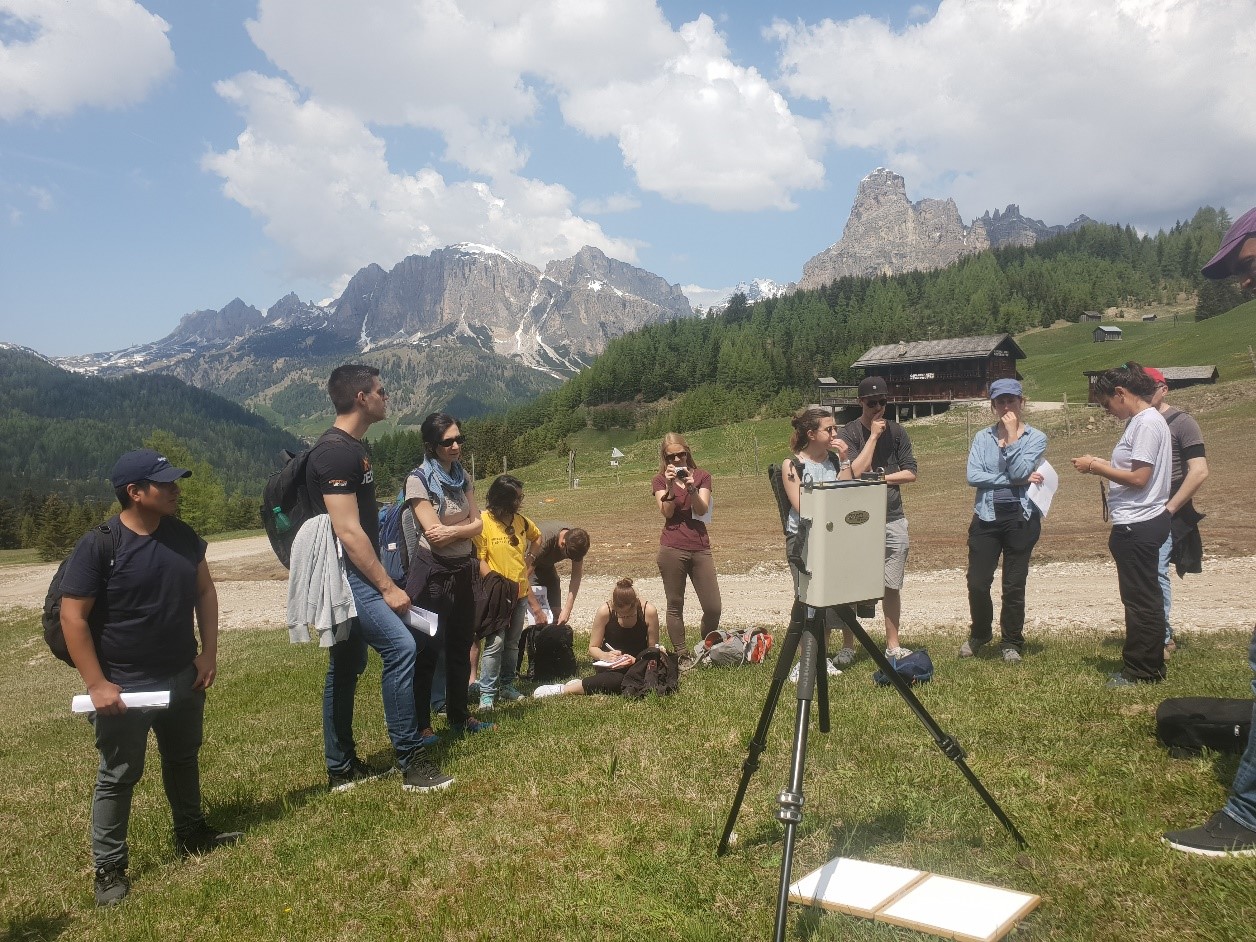
Figure 4. Calibration of the spectroradiometer with a white target before using it to collect data from: a) unhealthy vegetation, b) healthy vegetation and c) bare soil.
The field trip was a good combination of learning and having fun while enjoying the beauty of the surroundings in Corvara.
Day 3: LiDAR & poster session day
LiDAR processing using LAStools by Martin Isenburg
The presentation started with some general information about LiDAR data, while the biggest part of it was about the steps that one can apply on LiDAR and how to do so using LAStools. I found the presentation very engaging and thus, easy to follow. 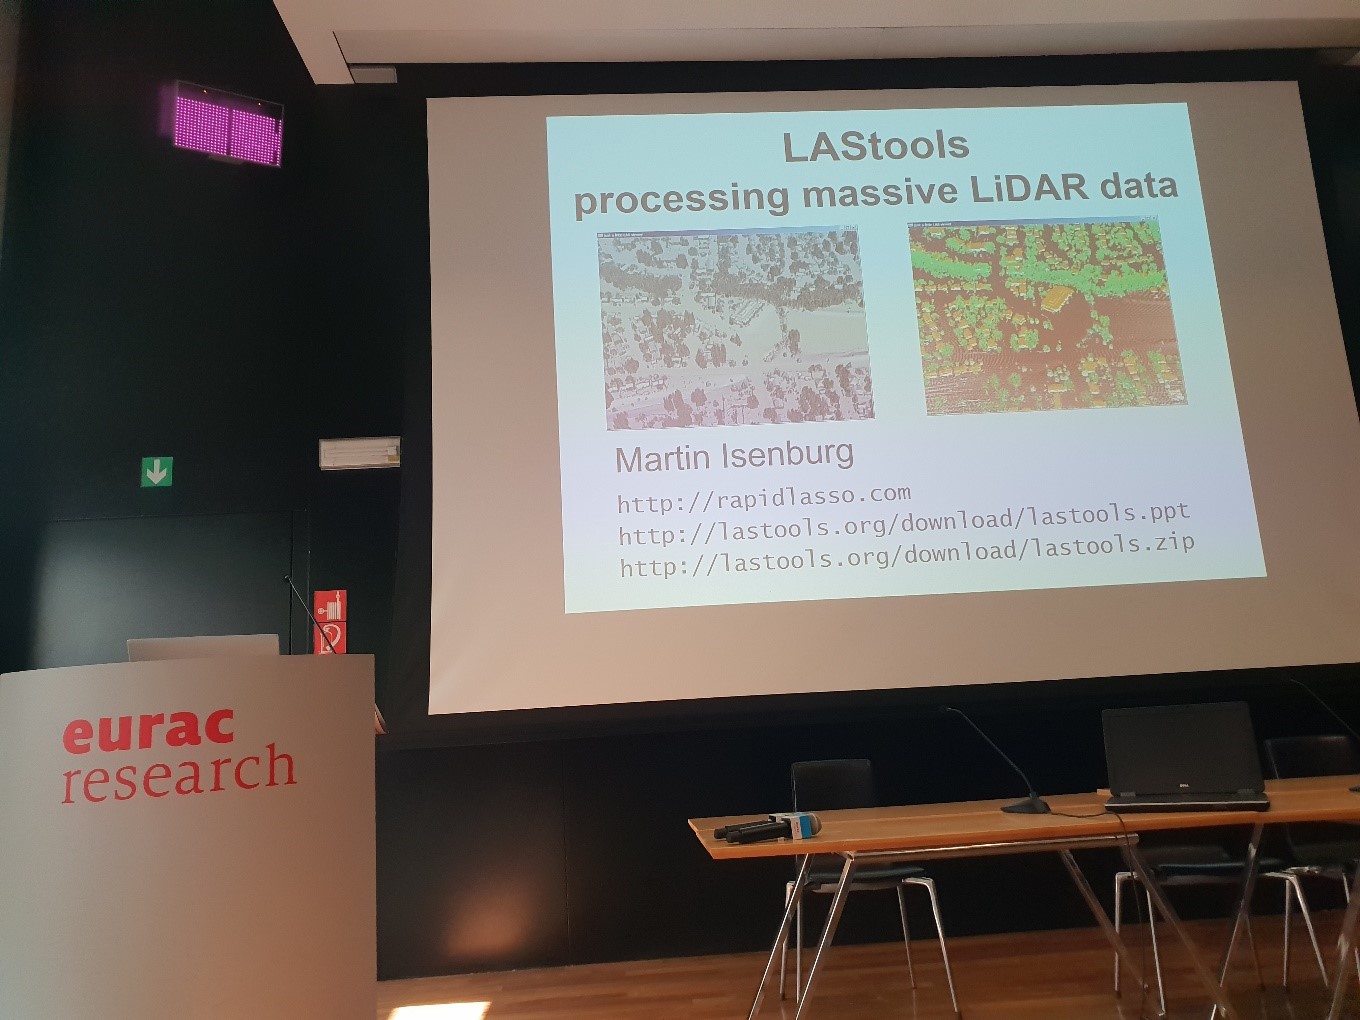
Figure 5. Before the presentation about LiDAR processing with LAStools from Martin Isenburg.
Some of the things that we were taught during the hands-on course about LiDAR processing were:
- How to check if a LAS/LAZ file is complete and is not missing points that were recorded due to some post-processing.
- How to get general information about a LiDAR and use it for example to remove appropriately noise in the data or to create orthorectified images with appropriate grid cell size.
- How to assess the quality of LiDAR point clouds.
- Which format to use to store a DTM, a DSM etc. created from a LAS file in order to have faster performance.
- How to create tiles of LAS files and how to refine the tiling if you already have the LiDAR point clouds stored in tiles.
- How to compute forestry metrics from LiDAR point clouds.
Poster Session
In the afternoon of the same day we had the opportunity to present our work. 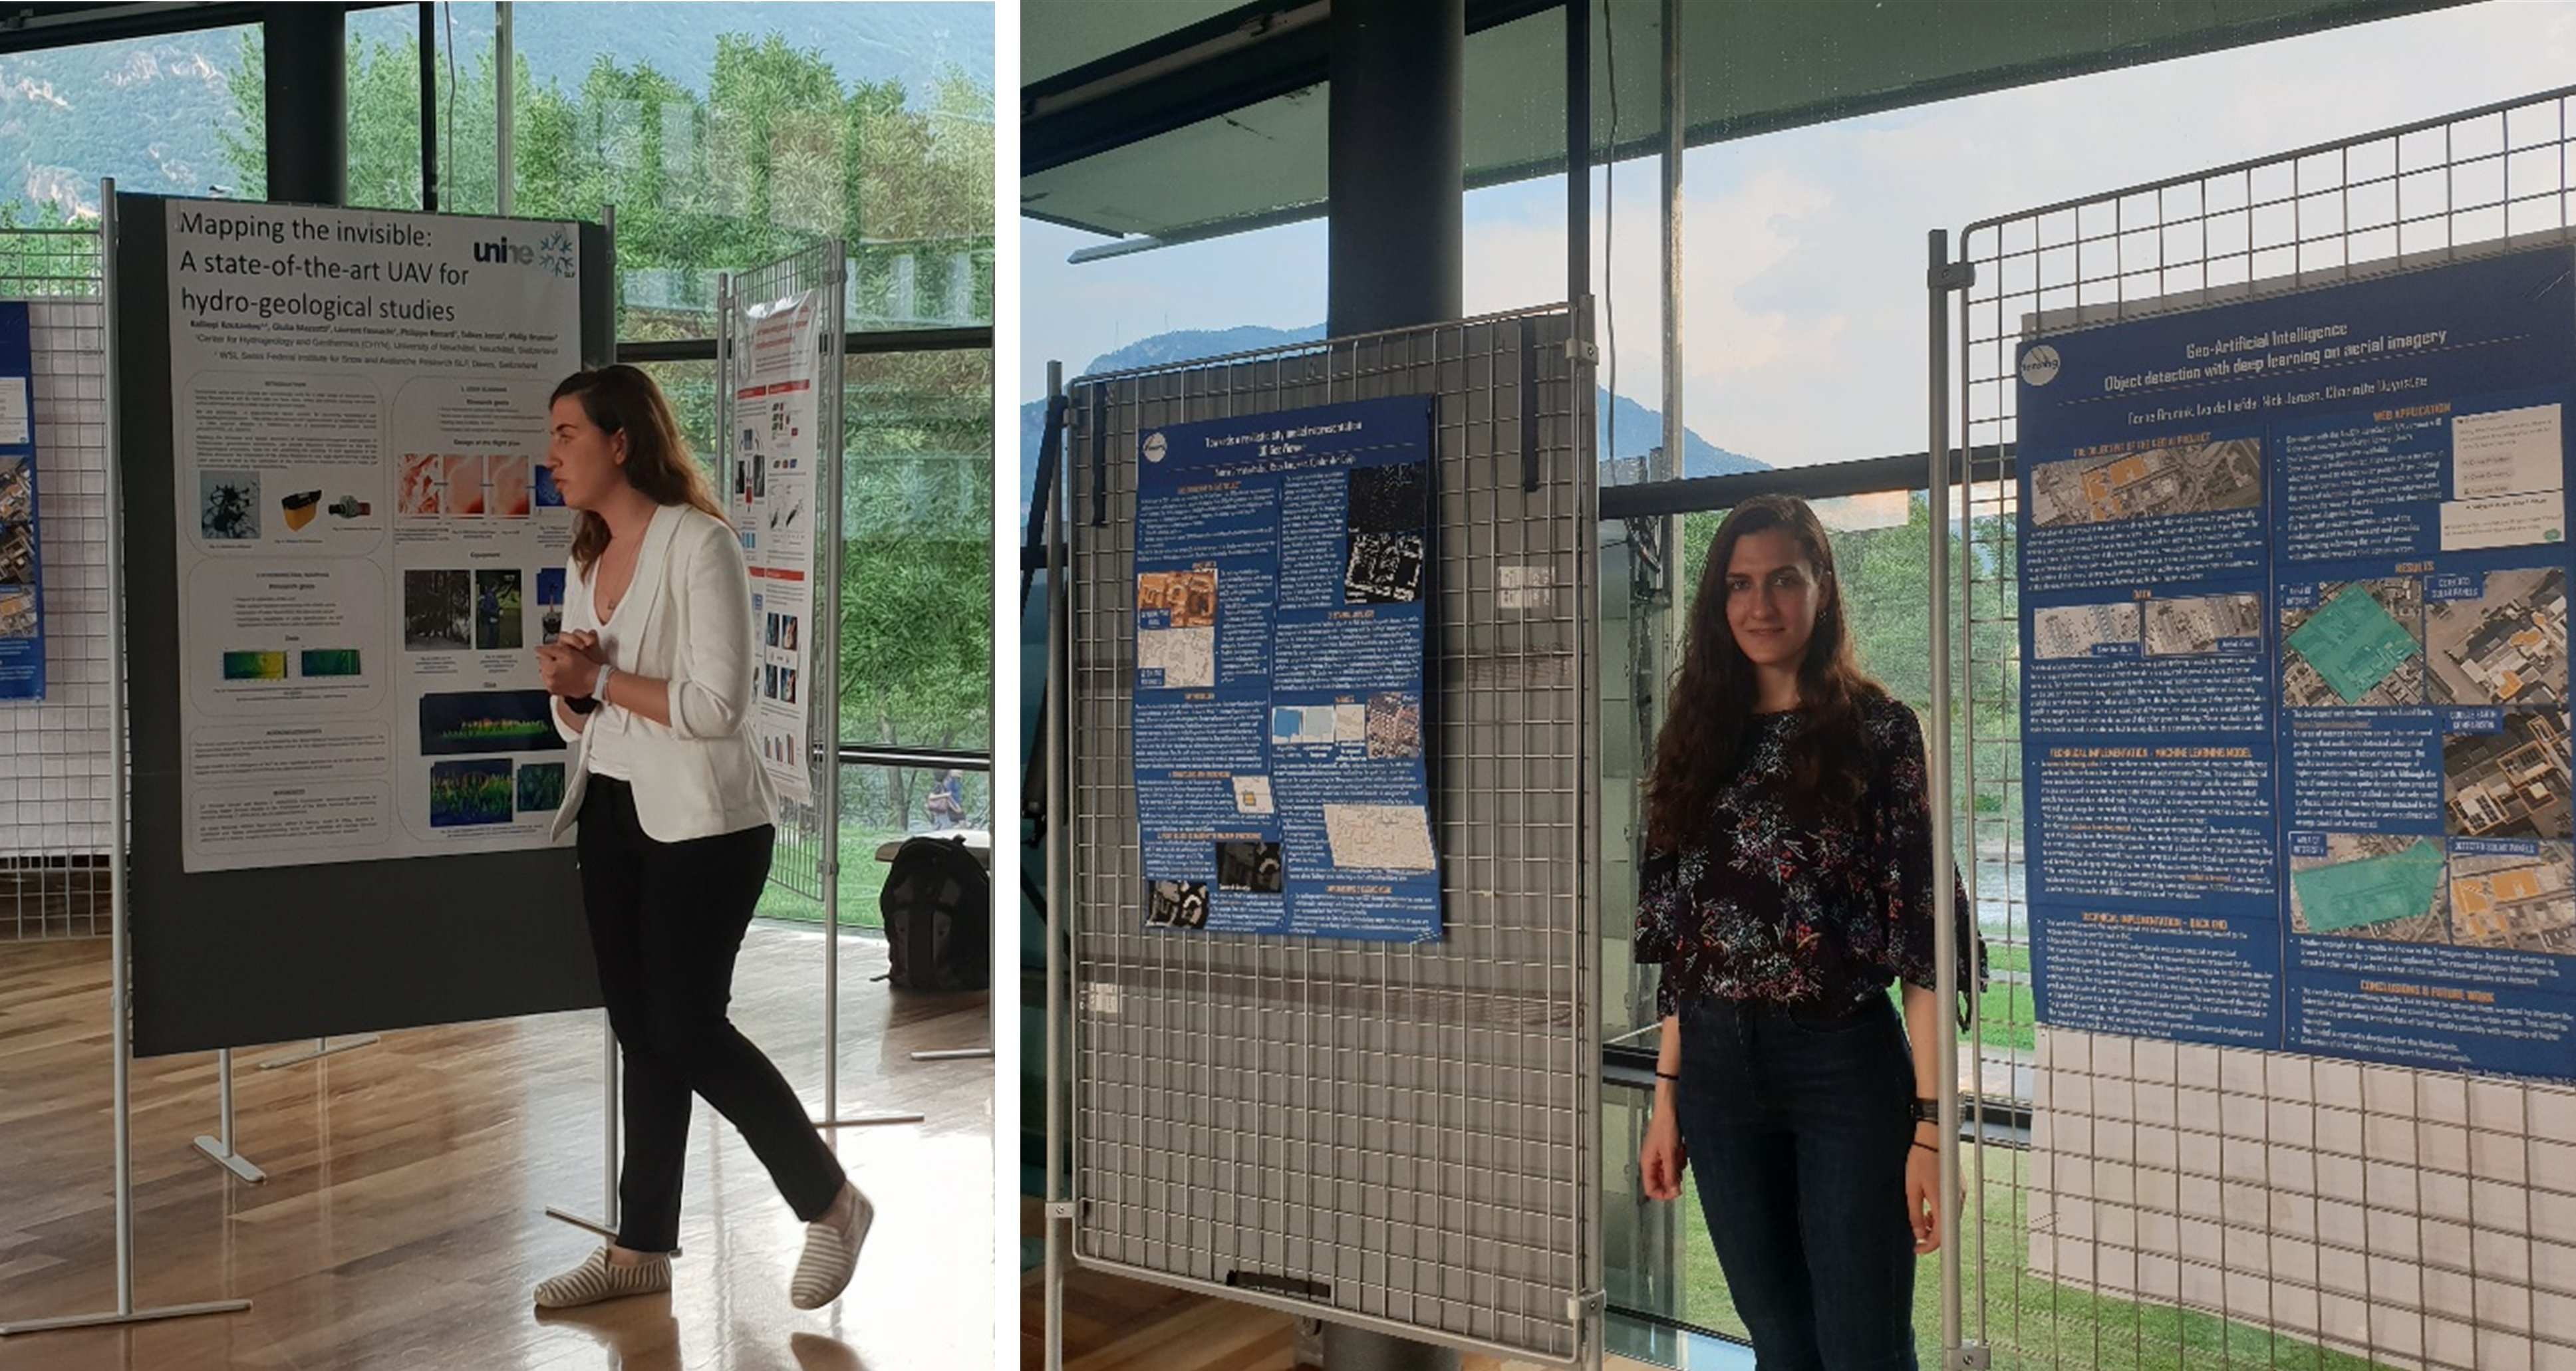
Figure 6. In the left image, one of my co-participants, Kalliopi Koutantou, a Ph.D. candidate in UAV-based remote sensing in University of Neuchâtel in Switzerland presenting her research work. In the right image, me with the posters that I presented. The one poster was about the ‘3D buildings generation’ (in LOD2) that I have been working on with my colleagues from Tensing GIS Consultancy, Roos Teeuwen and Xander den Duijn. The other poster was about the project ‘Planet Object Detection’ of my colleagues Corne Brunink, Ivo de Liefde, Nick Janzen and Charlotte Duynstee.
Day 4: Land cover mapping day
By Alexander Jacob and Ruth Sonnenschein
The subject of the 5th day was the mapping of land covers using satellite imagery, or in other words the detection of the “(bio) physical cover of the earth’s surface”.
Some of the most important knowledge points of the day were:
- Which methods/algorithms could be used for land cover image classification, their advantages and disadvantages.
- What metrics to use for estimating the accuracy of an image classification algorithm.
- Best practices for the size and the spatial distribution of the training samples (i.e. reference data for training and validation).
- Where to find open ground truth data about land use and land cover for Europe.
- Information about a future space mission where the satellite will carry for the first time the longest radar wavelength and thus, its signals will be able to penetrate at a certain degree the soil surface.
Day 5: Landslide monitoring & Deep Learning day
Landslide monitoring using UAV-based photogrammetry by Abraham Mejia-Aguilar
During this workshop:
- We went through the fundamental photogrammetric concepts, the modern photogrammetric techniques, the UAV-based photogrammetry, its advantages and disadvantages.
- We used the software Pix4D to apply the relative and absolute orientation of the images collected with a UAV, to create an ortho-mosaic of the recorded area, a DSM and a DTM based on images collected with a UAV.
- Eventually we corrected the generated DSM for the difference between the geoid in recorded area and the ellipsoid used by the reference coordinate system of the GPS stations.
Deep Learning for Earth Remote Sensing by Ribana Roscher
Although a challenging subject to explain, the presentation was very perspicuous.
- It started with a brief reference to the methods that can be generally used to apply image classification and continued with the different machine learning tasks for image interpretation, such as semantic segmentation and instance segmentation.
- It was explained when it is better to use machine learning instead of the classical classification methods used for remote sensing.
- A thorough description of the techniques used for learning features in neural networks followed.
- We learned about an efficient method for determining the weights in a neural network such that the estimated output is as close as possible to the target output.
- We were taught the steps to train a neural network from scratch, the best practices on how to use the training data and the types of neural networks, with a focus on the convolutional neural networks.
- During the practical part, we were changing the input parameters in an already implemented Convolutional Neural Network (LeNet) in order to best classify agricultural areas from satellite images.

Figure 7. During the explanation of neural networks in the presentation of Ribana Roscher.
Day 6: Hyperspectral data day
Mapping mountain areas with hyperspectral data by Loredana Pompilio
The last day of the training was about hyperspectral imagery where features are recorded in hundreds of bands of the electromagnetic spectrum and not in a few bands like for example in an RGB image. 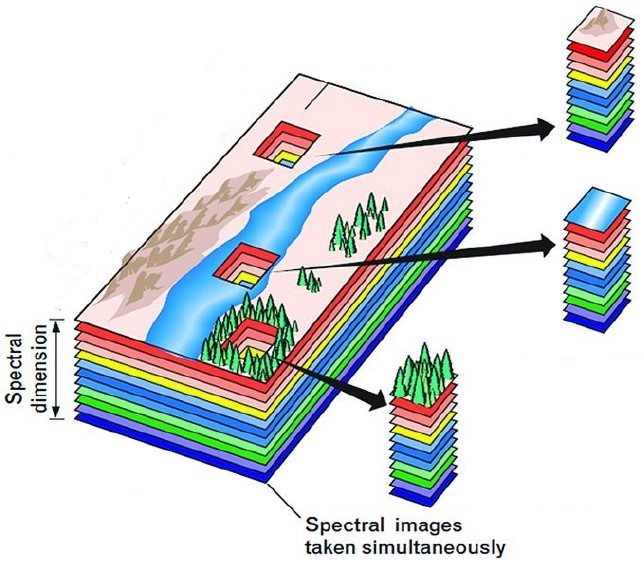
Figure 8. Each pixel of a hyperspectral image illustrates the reflectance of a target in several bands.
The highlights of this session were:
- The importance of hyperspectral data over multispectral data for image classification techniques.
- The two most commonly used methods to apply classification on hyperspectral imagery. These methods model hyperspectral data and use the modelling output to apply classification. One of the described methods generalizes the high amount of data by representing the continuous radiance response of a pixel with a vector. The other method in comparison, employs the reflected radiance values in each band of the electromagnetic spectrum for a pixel to create a continuous curve. Different targets (e.g. vegetation and water) will be represented by different vectors with the first method and different curves with the second method. In the practical session we used the first method to create training data and apply supervised classification using the software ENVI.
- The existing airborne hyperspectral imagers & hyperspectral satellite missions.