.png)
Data Science and Geographic Data, where does your organization stand?
Tensing

Tensing helps organizations to establish a future-proof data infrastructure. This can range from building pipelines for large-scale data processing to developing an innovative data science solution. This enables our clients to get more value out of the various data sources they have at their disposal.
To map out where an organization currently stands and where the potential value lies, we developed the Geospatial Maturity Index. This is a model that breaks down harnessing the potential of geographic data into four maturity levels.
In this article we describe the Geospatial Maturity Index and the four steps of the model. We also elaborate on the importance of data science.
The importance of spatial data
The Geospatial Maturity Index classifies organizations based on the exploited potential of spatial data. But before I go into more detail about the index and the various levels, I would like to emphasize the importance of spatial data as part of a future-proof data infrastructure.
When talking about the geographic component in Machine Learning, Artificial Intelligence or Data Science in a broader sense, it is not always immediately visible to the user of an application. Yet there are a lot of solutions that have geographic component in them. Here are two examples:
- When machine learning is applied to recognize objects in (aerial) photographs, the location of the imagery can also be used to determine its location, shape and relationships with the environment. Not only can recognized objects be input for further geographical analysis (how objects influence each other), but with multiple consecutive photographs, spatial movements of objects can be recognized. This makes it possible to map out movement patterns, including direction, speed and any deviating behavior.
- In addition to object recognition, geographical relationships often play an important role in predicting future trends. For example, it is now known that travel behavior and the congregation of larger groups of people played a major role in the development of the Covid-19 virus. Or in other words, trends in spatial movements and spatial concentrations. This is indicative of the law that entities that are close to each other influence each other more, than entities that are physically far away from each other. This same principle plays a role in a variety of solutions, from predicting the value of real estate, to predicting the lifetime of distribution pipelines or automatically analyzing solutions around the nitrogen issue.
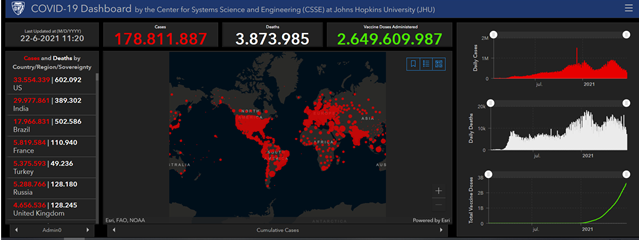
Covid-19 Dashboard
Or in other words, trends in spatial movements and spatial concentrations. This is indicative of the law that entities that are close to each other influence each other more, than entities that are physically far away from each other. This same principle plays a role in a variety of solutions, from predicting the value of real estate, to predicting the lifetime of distribution pipelines or automatically analyzing solutions around the nitrogen issue.
The different levels of the Geospatial Maturity Index are also explained in the webinar 'A Spatial Perspective on Business Intelligence'.
The four levels of the GeoSpatial Maturity Index
The Geospatial Maturity Index thus indexes 'how far along' an organization is in the deployment of spatial data. This index can be used to quickly determine where an organization currently stands and what the logical steps are for further utilization of geospatial data.
The index consists of four levels; those of collecting spatial data, using geographic visualizations to gain insights, to applying data analysis to spatial data and finally using the geographic component of data in Artificial Intelligence applications. The levels are described below:
Level 1 - Geographic data collection
The first category concerns companies that collect (geographic) data for capturing entities and processes. By means of consulting and manually interpreting the data, choices are made in the business processes. This could include address lists maintained in Excel or sensor data whose location is stored only as a metadata tag.
Level 2 - Geographic visualizations
The second category of organizations uses geographic data visualizations to better interpret and publish to a wider audience. This includes, for example, organizations that present their assets on a map so that field workers can easily locate them and query their properties.
Level 3 - Geographic Analysis
The third category includes organizations that see the potential of geographic data and incorporate it into their data analyses. Spatial patterns and geographic analysis lead to new actionable insights at this stage. Utility companies use geographic data to apply network analysis, for example, to map the impact of a pipe rupture on the supply area so that affected customers can be informed immediately.
Level 4 - Geographic AI
The last category contains the most innovative organizations. Here, geographic data is not only used to perform analyses that make statements about the past to the present, but in this category machine learning and AI are also deployed. With this, much more complex analyses can be performed, and predictions made about the future development of processes or the future state of entities. This is the category where there is still profit to be made for very many organizations.
Why Data Science with spatial data for your organization?
The highest step is the stage where Machine Learning (ML) and Artificial Intelligence (AI) are also deployed. These data research fields are changing the way organizations function. Based on data, choices are substantiated or made completely automatically. This creates opportunities to build more efficient, accurate and less labor-intensive solutions.
AI is perhaps the most exciting development in the market at the moment and it is therefore also finding its way into Geographic Information Systems (GIS). Where GIS started in the 1980s as a basic supporting (but super innovative!) tool for cartographers, it has now grown into a complete platform in which the entire process of data collection, management and analysis are facilitated with the latest technological developments, including the use of ML & AI.
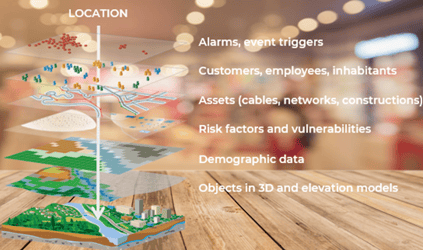
The location component of data contains a lot of information that can be mined with AI. It is therefore not without reason that almost every app nowadays asks for your location data and an increasing number of satellites are shot into orbit to collect imagery.
The geographic perspective provides the opportunity to recognize entities and processes at different scales, which play a major role in everyday life. All business processes take place in space and time, therefore leaving this aspect untapped in predictive models is a missed opportunity to say the least.
Webinar: A Spatial Perspective on Business Intelligence
Spatial data, or more broadly Geospatial Intelligence, is changing the way we look at the world. It helps organizations discover trends and better understand developments. Therefore, the use of spatial data is an essential complement to traditional business intelligence.
In the webinar 'A Spatial Perspective on Business Intelligence' Dave Laurier, managing director at Tensing, explains in an inspiring way how your organization can grow using spatial data and the right technology. He also mentions numerous applications of geospatial intelligence in practice.