.png)
Getting started with a BAG dataset in Tableau

Michael Tuijp
Geospatial Data ScientistAt Tensing, we help organizations transform large amounts of data into valuable and useful information. This data may be internal data, but also public data. Public data can lead to new insights. Using a BAG (Address and Building Registers) dataset from the Kadaster, I will show how to use open data in Tableau. Tableau is a Business Intelligence and analysis platform that helps to see and understand data.
Snowflake
In Snowflake, Tensing provides a user-friendly copy of the official registration of Dutch addresses and buildings. Snowflake is a cloud-based data & analytics platform and offers all the flexibility and almost infinite scalability to easily load, integrate, analyze and securely share your data. On this page you can read about what Snowflake can do for your organization.
In the video 'Empowering spatial insights with FME in Snowflake' specialist Thom from Tensing and Arjan from Snowflake talk about the possibilities Snowflake has to offer in the field of spatial data. Download the recording below.

BAG dataset
The dataset is generated from the monthly 'BAG' delivery of the Land Registry. The BAG is part of the governmental system of basic registrations. The Dutch municipalities are the owners of this data and are legally obliged to maintain this data and to share it as open data via the Land Registry.
The BAG contains the following information of all buildings in the Netherlands. We differentiate 5 object types:
- Buildings
- Properties
- Number designations
- Public spaces
- Towns
The attributes we use in the BAG include status, area, x-y-coordinate, year of construction, geometry and purpose.
Getting started in Tableau
With an example query, we loaded data of 50,000 buildings around the Oude Kerk in Amsterdam into Tableau. You can run queries on any type of data that is interesting for any spatial use-case you can think of! Tableau is a great visualization tool that is easy to integrate with Snowflake queries.
Download the corresponding Tableau file via this link and open the example query via this link.
As you can see in the animated Tableau dashboard below, you can easily visualise, filter and export data from buildings of interest to you.
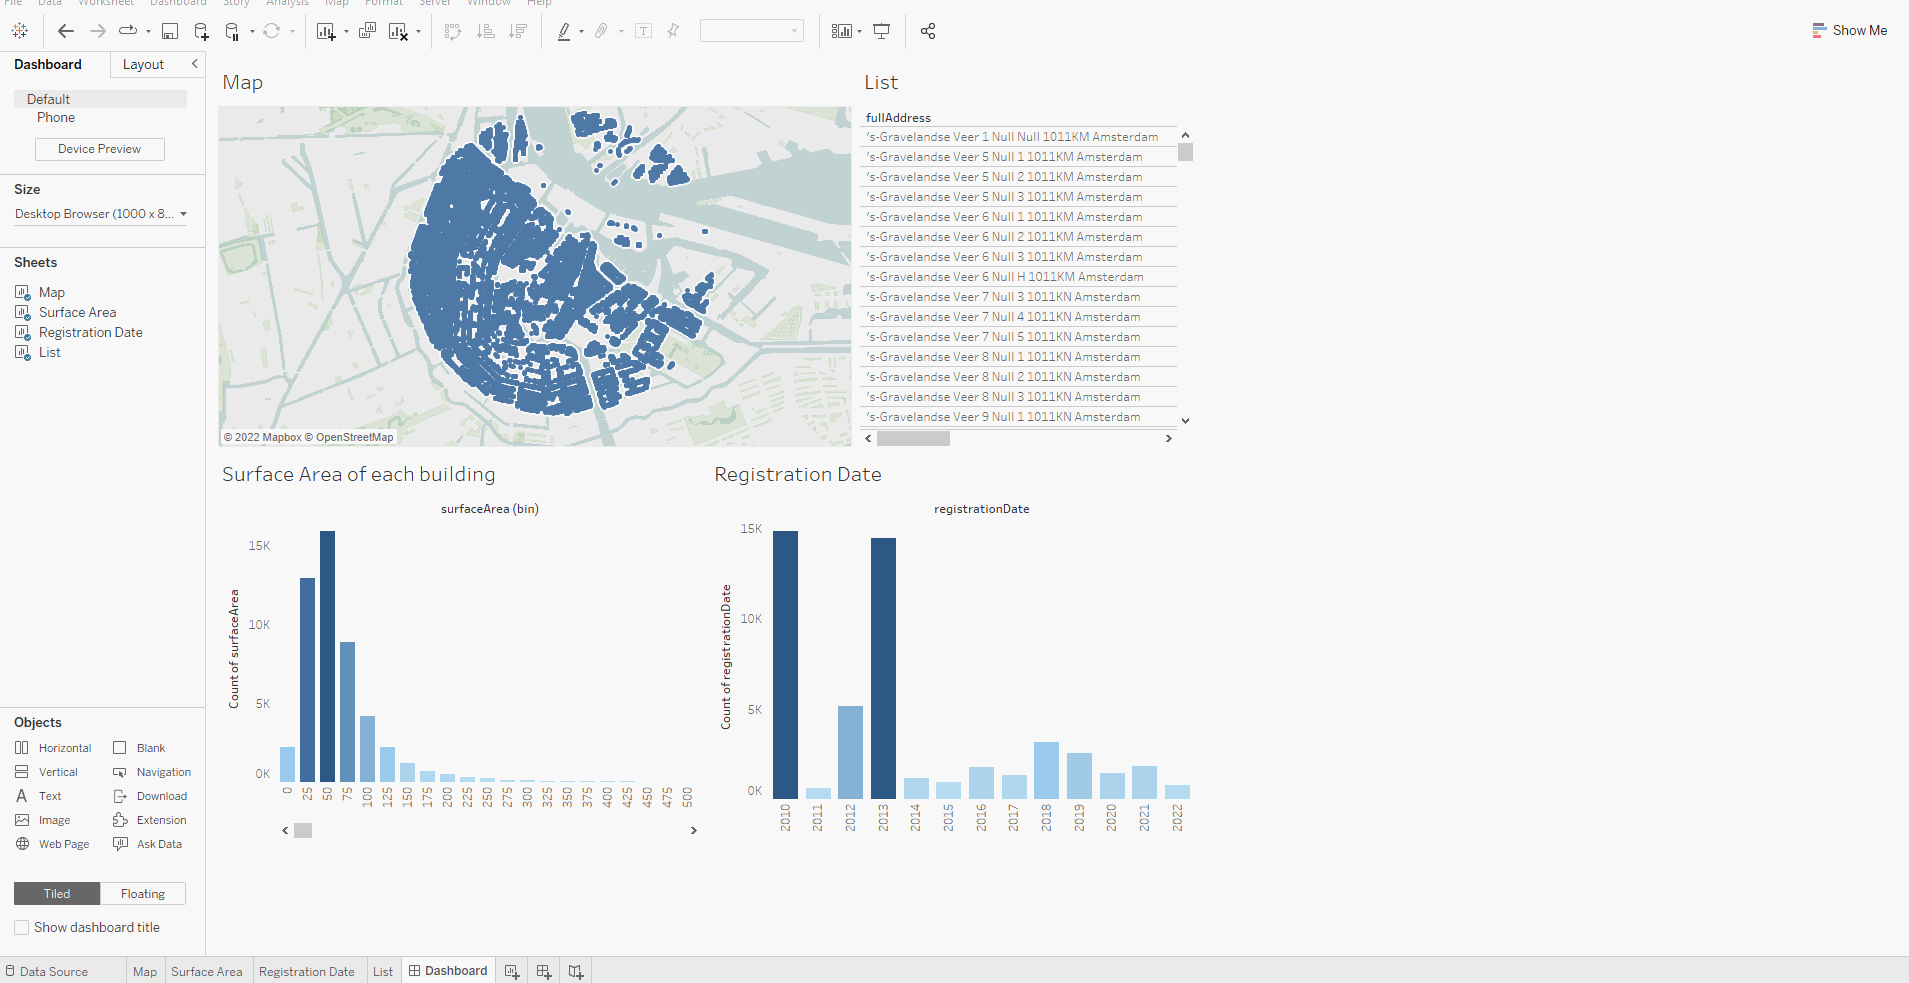
The animated image shows how to connect to the Snowflake database and load the data into Tableau.
Through the Snowflake Data Marketplace you can connect to the BAG data. Click on this link and log in with your Snowflake (free trial) account. After you have connected, select the BAG database data in Snowflake. In the animated image below you can see how to connect to the Snowflake database and load the data into Tableau.
.gif?width=1909&name=Snowflake-Tableau-Data-Load%20(1).gif)
Finally, you can drag any table into the selection, right-click on it and convert to custom SQL. Then copy the query at the bottom of this blog and click 'OK'. The data from the example above should then be loaded into your Tableau workbook.
In future blogs, we will discuss use cases in more detail, including cases with Machine Learning, Databricks & Esri. If you have any ideas or questions about interesting queries, please contact us using the button below.