


.png)
Visualization suitable roofs for placement of solar panels

Michael Tuijp
Geospatial Data ScientistThe municipality of Haarlem encourages its citizens to install solar panels, but at the same time wants to preserve the appearance of the historic center. This is only possible if the panels are placed on roof sections that are not visible from the street. The municipality therefore looked for a solution to identify suitable roof areas and share the information with citizens in an accessible and convenient way. The municipality of Haarlem hired Tensing to do this.
The solution we built is a viewer in which citizens can see which roof parts are suitable for installing solar panels. In this article I highlight the problems and opportunities that the municipality of Haarlem faced, the Solution that Tensing has come up with and how we have built and implemented the solution.
Are you curious about the entire project at the municipality of Haarlem? Download the case study here.
The current situation
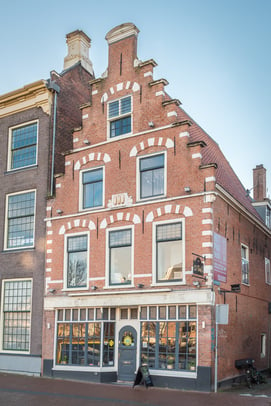 The municipality of Haarlem has the mandate to produce more green energy and therefore encourages the citizens of the municipality to place solar panels on free and eligible roof areas. However, the disadvantage of randomly placing solar panels is that the aesthetic appearance of the city can be affected considerably. Especially a city center that consists of mostly century-old buildings.
The municipality has made a policy for the placement of solar panels, whereby placement in the inner city is only allowed on flat roof sections or roof sections out of sight of the public road. In many cases people are not quite sure whether their roof (part) is flat or sloping and whether it is visible from the road or not. As a result, the municipality often receives questions from citizens who do not know whether they are eligible to install solar panels.
Many municipalities manually classify roof sections. Employees must go out to do this to see if roofs are flat or sloped. In larger cities that contain thousands of homes and tens of thousands of roofs, manually classifying them takes an enormous amount of time and money.
Proposed Solution
The municipality of Haarlem asked Tensing to develop a solution for this problem. We built a viewer in which citizens can see which roof parts are suitable for installing solar panels.
To build the viewer we used FME. FME (Feature Manipulation Engine) is a data integration platform from Safe Software. The platform allows to easily connect a large number of applications, transform data and automate data processes.
Our proposed solution consists of three separate datasets and the corresponding FME processes, allowing the municipality to reproduce the results when new data is available.
The three datasets are delivered on multiple levels:
- Dataset #1 contains a 2D map of all roofs from each BAG address within the inner city, containing a classification on whether it’s a flat or slanted roof and whether the building has a monumental status or not (this is important in the municipality’s policy);
- Dataset #2 contains a 2D map of all roof parts from each BAG address within the inner city containing a classification on whether it’s a flat or slanted roof and whether the building has a monumental status or not;
- Dataset #3 contains a 2D map of the viewsheds of the roof parts from each BAG address within the inner city which are visible from the public road.
With these datasets, the municipality can show which roofs and roof sections are flat or sloped, which are monumental and whether the roofs are visible from the public road.
The result
By combining the three datasets, the municipality of Haarlem has access to an online and public policy map which roofs and roof parts are eligible for the installation of solar panels. The viewer is on the website of the municipality of Haarlem and can be viewed here.
The results in a row:
- The municipality now has access to an online and publicly accessible policy map which roof parts are eligible for the placement of solar panels;
- The municipality can use the three processes to generate the different datasets independently in the future;
- An open viewer of the policy map is available.
By combining these datasets into one dataset, the municipality can create a policy map. In this policy map, Haarlem citizens can easily look up their house and see if they can install solar panels or not.
Do you want to learn more about the data sets and the viewer? Download the full casestudy.
Did this project pique your interest? If so, check out our case study overview. And if this use case in particular seems interesting to you for your own municipality or organization, please contact us.